Year 4: Draw Line Graphs
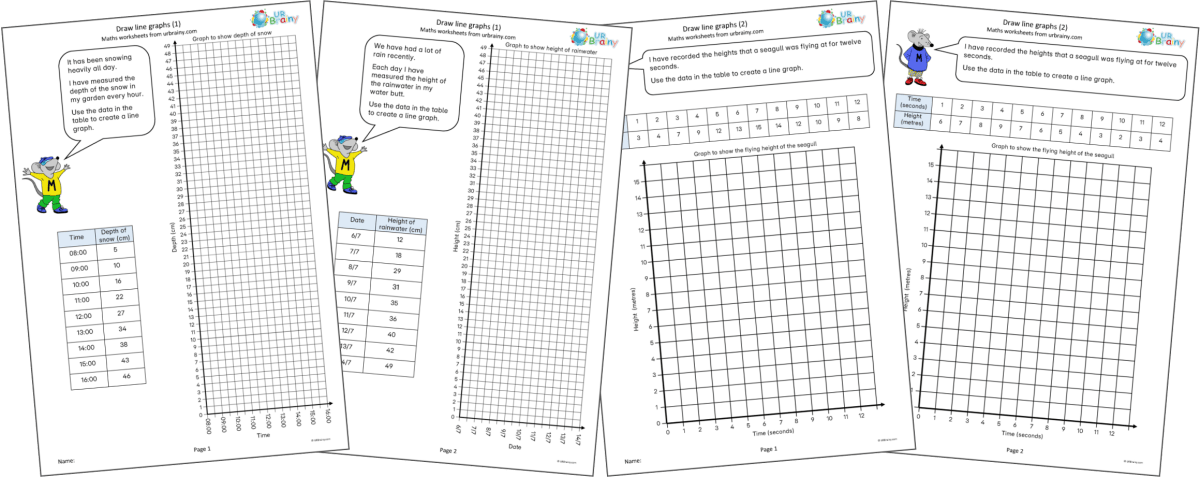
Children are introduced to line graphs for the first time in Year 4. A key part of this is to understand continuous data. For example, the temperature of a room can change all the time, so it is not appropriate to use a bar chart or block graph to show this. A line graph allows readings to be taken between the intervals. When drawing their own graphs, it is important to remember to label axes clearly and space the intervals evenly along the axes.
We have just published two sets of pages for children to use the data provided to create a line graph. Both of these use pre-drawn axes as the focus is on plotting the points accurately.
Download NowSubscribe to our newsletter
The latest news, articles, and resources, sent to your inbox weekly.


© Copyright 2011 - 2026 Route One Network Ltd. - URBrainy.com 14.0.35