Skip to content

Organise data into a table, draw graphs and interpret results, including using the mode and range.

Preview of ' 
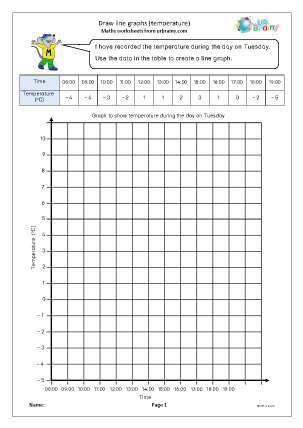
Collect and organise data'

Create my FREE account

including a 7 day free trial of everything

Already have an account? Sign in

Free Accounts Include

  • View / Print monthly free resources forever
  • View everything for 7 days
  • Choose any 5 resources to download

Subscribe to our newsletter

The latest news, articles, and resources, sent to your inbox weekly.

© Copyright 2011 - 2024 Route One Network Ltd. - URBrainy.com 11.1.7